Overview
GPS data has become ubiquitous with performance management and it provides a mountain of data on how far someone ran, how fast they did it, how many times they started and stopped along with a bunch of other numbers. In the APM platform, we've simplified it down to four key metrics (distance, HMLD, high intensity and sprints) that we're using to help athletes and organizations understand capacity, better manage load and provide clarity on actionable steps.
Data Collection
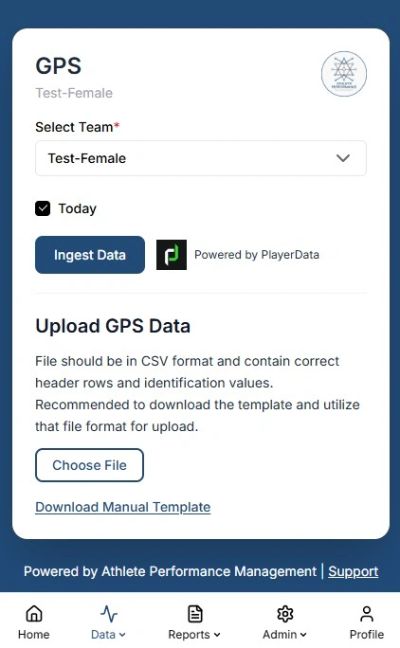
Our GPS setup is intended to be seamless and easy to configure. Our current integration is with PlayerData (https://playerdata.com/) and setup takes about 1 minute once all the configuration values are received from PlayerData. You can visit support to get additional details on setup (https://athleteperformancemgmt.com/support-gps). Once configuration is setup, ingesting today's data is one-click. Additional configuration allows the user to select a time window to pull in additional data.
In addition, an organization can upload data manually to address situations where GPS data is not available (tracker went dead, player forgot to wear tracker) or where they want to augment data from other organizations (national team data sharing, external private training). A simple template is able to be downloaded which provides all the necessary keys so that manually added data can be properly mapped to players.
Metrics
Distance is a foundational metric, but it is the least critical as much of it depends upon internal processes on when you hand out trackers, the setup of sessions, etc. We monitor it because it is a large number, so minor things don't impact it too much when it's consistent within your program. Outliers are easy to spot and should trigger a conversation.
HMLD stands for high metabolic load distance. We consider this the most important metric and one where target development and management should be focused. It incorporates speed, distance, accelerations, decelerations and is ultimately a proxy for work.
High intensity distance is intended to represent a good running speed. We recommend configuring your GPS tool to identify 70% of max speed as the threshold for high intensity running.
Sprint distance is intended to represent high taxing running speeds. We recommend configuring your GPS tool to identify 85% of max speed as the threshold for high intensity running.
Summary
We focus on these four metrics as distance provides a total volume and HMLD provides the base line athlete capacity. High intensity and sprinting provide context for HMLD so we can get a better sense of where the players' work rate is coming from (e.g., is it coming from a significant number of high speed runs or is it coming from accelerations and decelerations but not getting to top end speed). Ultimately you require distance to get to 70% of max and even more distance to get to 85% of max, so this comparison gives us insight to how the player is training and playing.
All of this is important and why we are building a target building model which will allow organizations to create player-level targets based on their capacity, how they play and train and how they want to grow/maintain capacity at various parts of the season.
Scaling

Whether a player plays 20 minutes or 80 minutes in a match, the system provides ability to automatically scale partial matches to full match numbers based on the input of your performance coach. In addition, the system provides baseline numbers to minimize over-estimating a full match load.
Models

System provides 6 baseline models to choose from, all based on individual player data to dynamically build targets on a weekly basis. Player Max and Player Average use the totals on a weekly basis as the base metric. Match Max and Match Average use a player's actual match data as the base metric. And Scaled Match Max and Scaled Match Average use the normalized Match data (using the scaling factors) for each player.
The multiplier then allow a performance coach to determine how they want the math to work to calculate the targets based on the base metric and each of the key measures. Multipliers can be customized at the player level to allow additional personalization based on the status of the player.